
Heart Failure RPM ROI: A CFO-Grade Model You Can Defend
Build a defensible heart failure RPM ROI model with Rhythm360. Real inputs, Medicare data, and worked examples included. Start calculating now.

This guide walks through the four inputs that drive heart failure RPM ROI, a worked example using published benchmarks, and the break-even thresholds every program should know before scaling.
Key Takeaways
- Heart failure RPM ROI comes from avoided hospitalizations, avoided ED visits, reimbursement revenue, and total program costs, not a single fixed percentage.
- Published evidence shows an approximate 20% relative reduction in HF hospitalizations, with program-level ROI ranging from slightly negative to over 90% depending on patient selection and operational efficiency.
- Programs fail when they enroll low-risk patients, layer RPM on existing workflows without redesign, experience low transmission compliance, or collect data without acting on alerts.
- High-risk, recently hospitalized NYHA Class III/IV patients with reduced ejection fraction deliver the strongest ROI because they have the highest baseline readmission rates.
- Rhythm360 unifies CIED and HF/HTN data on a single platform, automates CPT capture, and cuts critical alert response times by up to 80% to help practices scale profitably.
Schedule a Demo With Rhythm360
Prerequisites: Core Inputs for a Defensible HF RPM Model
A defensible HF RPM ROI model rests on four concrete inputs before any calculation begins.
- Baseline patient population data: NYHA functional class distribution, ejection fraction, and number of HF hospitalizations in the prior 12 months. These determine the expected hospitalization reduction and the avoided-cost numerator.
- Current program cost structure: Staffing (RPM RN, program coordinator, medical director), technology platform fees, device costs, and patient onboarding overhead. Staffing alone runs $75,000–$90,000 annually per RPM RN managing 150–250 patients, a figure most vendor ROI calculators omit.
- Reimbursement assumptions: Payer mix (Medicare, Medicaid, commercial), expected CPT code capture rates, and patient transmission compliance. The denominator in an RPM ROI calculation is productive, clinically managed patients, not enrolled patients.
- Clinical workflow capacity: Alert triage staffing, EHR integration status, and documentation infrastructure. Programs that lack these generate data without acting on it, which destroys ROI.
Step 1: Use a Clear, Consistent ROI Formula
Net ROI = avoided hospitalization costs + avoided ED costs + RPM reimbursement revenue − program costs. ROI % = net savings ÷ program cost × 100.
Two distinctions matter. Fee-for-service providers and risk-bearing organizations use different ROI equations and should never combine them, because combining them double-counts value. Remote interrogation of implantable devices (pacemakers, ICDs, loop recorders) also uses its own device-monitoring CPT codes, separate from the 99453–99458 RPM family, and combining unrelated monitoring services into one reimbursement model is a common and costly modeling error.
Step 2: Build a Worked Example Using Published Inputs
The example below uses published cost and utilization benchmarks. Substitute your own figures for a practice-specific result.
- Program cost: In the peer-reviewed NYU Langone RPM-HTN program (100 patients enrolled), the average program cost was $330 per patient per year (range $208–$452), covering device costs and clinical staff review time.
- Baseline HF hospitalization rate: A program-specific input that varies widely by enrolled population and should come from your own claims data rather than a single published benchmark.
- RPM hospitalization reduction: 20% relative reduction → 0.10 avoided admissions per patient per year.
- Average net cost per avoided HF admission: The average cost per avoided heart failure rehospitalization is approximately $10,737, based on the lower bound of mean heart failure hospitalization costs in the United States.
- Avoided hospitalization value: 0.10 × $10,737 = approximately $1,074 per patient per year.
- Annual RPM reimbursement (Medicare, 12 months of 99454 + 99457): approximately $1,247 per patient per year ($52.11 × 12 + $51.77 × 12).
- Net ROI per patient: ($1,074 + $1,247) − $330 = approximately $1,991.
- ROI %: $1,991 ÷ $330 × 100 = approximately 603%.
Now stress-test the model at the break-even threshold. If hospitalization reduction falls to 0.04 avoided admissions per patient per year (an 8% relative reduction), avoided hospitalization value drops to approximately $429. Net result: ($429 + $1,247) − $330 = approximately $1,346, still positive because reimbursement revenue carries the model. Strip out reimbursement, such as in a risk-bearing organization or a low-compliance program that cannot bill 99454 consistently, and the model turns negative at this reduction rate. Programs with higher baseline readmission rates and higher average readmission costs require a lower relative RPM reduction to break even, which makes patient selection the single most important ROI lever.
Step 3: Connect the Worked Example to the Evidence Base
The 20% reduction used in the worked example comes from published evidence. Four analyses converge on the same direction of effect while showing that benefit size depends heavily on patient selection and monitoring modality.
Study Population Economic Finding Source Meta-analysis (15 studies, 2025) HF patients across multiple trials 20% reduction in HF-related hospital admissions (RR 0.80, 95% CI 0.77–0.84); implantable hemodynamic monitors reduced HF hospitalizations by ~28%MediRemote, 2025 pooled analysis Finnish Telemonitoring Study (Kokkonen et al., 2024) 43 recently hospitalized HF patients; 6-month pre-post comparison 36% reduction in overall costs per patient inclusive of onboarding; 51% fewer all-cause hospitalizations; 47% fewer ED visitsGDHP / Medixine; cited in JMIR 2026 (doi:10.2196/51841) EPOCA Markov Model (Leleu et al., JMIR 2026) 722 participants (mean age 87.9), 4 French hospitals, 2022–2024 €29,165 vs €39,929 per patient (collective perspective); net saving of €10,764; dominant strategy in 90% of simulations; 46% fewer hospitalizations, 54% fewer ED visitsJMIR Med Internet Res 2026;28:e80302 EHJ-QCCO Scoping Review (2026) HF and CIED patients across high-income settings Pulmonary artery pressure-guided monitoring consistently cost-effective; CIED remote monitoring generally cost-neutral or cost-saving vs in-office follow-up; largest savings in CRT recipientsEHJ-QCCO, 2026 (doi:10.1093/ehjqcco/qcag138)
Step 4: Tie Medicare Reimbursement to the ROI Equation
Medicare covers remote physiological monitoring for heart failure patients under four foundational CPT codes, with two new codes added in the CY 2026 Physician Fee Schedule final rule. These codes form the reimbursement side of the ROI equation and determine how much revenue each active patient can generate.
- CPT 99453 (initial device setup and patient education): $21.71, one-time per episode of care
- CPT 99454 (device supply and data transmission, ≥16 days in a 30-day period): $52.11/month
- CPT 99457 (RPM treatment management, first 20 minutes, including interactive communication): $51.77/month
- CPT 99458 (each additional 20 minutes of RPM treatment management): $41.42/month
The CY 2026 final rule also introduced CPT 99445 (device supply, 2–15 transmission days, $52.11) and CPT 99470 (first 10 minutes of treatment management, $26.05). Together they eliminate the prior scenario in which patients transmitting fewer than 16 days generated zero device-supply revenue. For a fully compliant patient, the combined monthly reimbursement from 99454 and 99457 is approximately $103.88, so a practice with 200 active RPM patients can generate approximately $24,000–$30,000 in monthly RPM revenue before accounting for avoided readmission penalties. RPM may also be billed alongside chronic care management (CCM) in the same month, provided the time counted toward each service is documented separately. Rates update annually, so verify codes in the Medicare Physician Fee Schedule before locking program ROI.
Step 5: Recognize When HF RPM Fails to Pay for Itself
HF RPM does not automatically generate positive ROI. A 2026 retrospective cohort study of 131 HF patients across two Dutch hospitals found no significant difference in HF-related hospitalizations between RPM and usual care (P=.47), while nursing workload nearly doubled, with mean 18.5 total consultations per patient versus 9.3 for usual care. The authors concluded that RPM was layered on top of existing care pathways rather than replacing them, so the expected hospitalization reduction did not materialize. Programs fail to pay for themselves under these conditions:
- Poorly targeted enrollment: Including low-risk patients (NYHA I/II, no recent hospitalization) who have a low baseline readmission rate, which makes the avoided-hospitalization numerator too small to offset program cost.
- Labor-intensive workflows without redesign: RPM added on top of existing care pathways increases nursing time without reducing cardiologist consultations or hospitalizations, as the Dutch study demonstrated.
- Low patient transmission compliance: Patients who transmit data on fewer than 16 days per month cannot be billed under CPT 99454, which collapses the reimbursement side of the model. Cellular-connected devices achieve 89% compliance versus 60–75% for Bluetooth devices, a gap that directly determines billing eligibility.
- Data collected without clinical action: Programs that generate alerts but lack the triage infrastructure to act on them produce workload without clinical or financial return. Alert fatigue is the single biggest cause of RPM program failure.
- Break-even hospitalization reduction not achieved: For a risk-bearing organization without reimbursement revenue, using the average hospital's Medicare reimbursement gain of $10,000 per avoided excess readmission, the program must avoid at least 0.06 admissions per patient per year to break even. If the enrolled population's baseline rate is too low or the intervention too weak, this threshold is not reached.
For a deeper look at the risks and limitations of HF RPM programs, see Disadvantages of Remote Patient Monitoring for Heart Failure.
Step 6: Build a Simple Risk-Stratification Framework
The evidence for HF RPM ROI is strongest in high-risk, recently hospitalized patients. The Finnish telemonitoring study enrolled recently hospitalized HF patients and achieved 51% fewer all-cause hospitalizations and a 36% reduction in overall costs. Implantable hemodynamic monitors outperform the pooled reduction cited earlier, which places them in the highest-risk tier.
Use a tiered enrollment framework and start with the highest-risk group:
- Patients discharged from a HF hospitalization within the prior 30 days, who have the highest baseline readmission rate and the highest avoided-cost numerator.
- NYHA Class III or IV patients with reduced ejection fraction.
- Patients with two or more HF hospitalizations in the prior 12 months.
- Patients with uncontrolled fluid retention or weight instability on current therapy.
Enrolling lower-risk patients before the program has demonstrated operational efficiency dilutes the population-level hospitalization reduction and raises the break-even threshold.
Step 7: Control the Operational Cost Side
Competitors in the HF RPM space frequently present reimbursement revenue without modeling the cost side. A 500-patient RPM program requires $235,000–$380,000 in annual staffing alone, and labor-intensive alert management workflows erode contribution margin at scale. The Dutch cohort study found that HF nurse consultation time per patient was 233.2 minutes in the RPM cohort versus 121.2 minutes in usual care, a near-doubling of nursing time with no offsetting reduction in physician workload or hospitalizations.
Rhythm360's vendor-neutral platform addresses the operational cost problem directly. By consolidating CIED and HF/HTN data into a single dashboard, automating CPT code capture and documentation, and reducing critical alert response times by up to 80%, Rhythm360 helps practices manage larger patient populations without proportional staffing increases. University of Chicago Medicine reviewed more than 73,000 reports annually through Rhythm360 in calendar year 2025, averaging more than 18,000 reports per quarter, with clinicians able to identify more abnormalities and act earlier, a workflow change that supports ROI through earlier intervention and reduced hospitalization severity. Rhythm360's automated CPT code capture and documentation helps practices recover previously lost revenue, increasing profitability by as much as 300%.
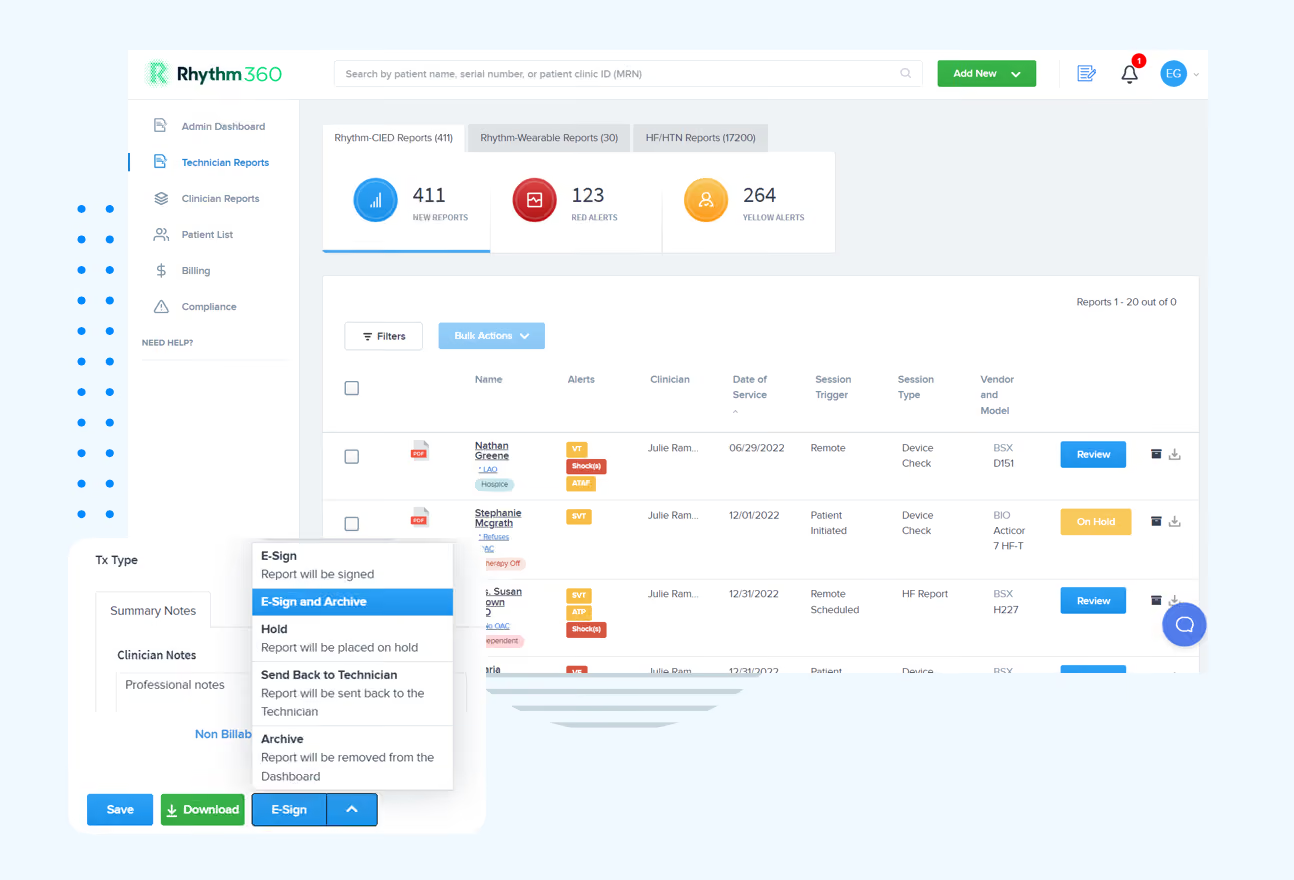
See How Rhythm360 Cuts Alert Response Time
How to Validate Your HF RPM ROI Model Is Working
A model only proves useful when operational data confirms it. Track these indicators monthly to confirm the ROI model is performing as projected:
- Alert response time: Time from alert generation to clinical action, with a target of under 24 hours for non-urgent alerts and immediate response for critical events.
- Documentation completeness: Percentage of billable encounters with complete CPT-compliant documentation, because gaps here translate directly to denied claims.
- Patient transmission compliance rate: Percentage of enrolled patients meeting the 16-day threshold required for CPT 99454 billing each month.
- Staff efficiency: Consultations per RPM RN per month, where a rising ratio without a corresponding increase in alert volume indicates workflow inefficiency.
- Clean-claim rate: Percentage of RPM claims paid on first submission, with a rate below 90% signaling documentation or coding gaps.
- Contribution margin per patient: Monthly reimbursement per active patient minus variable operating cost, which is the single number that determines whether the program scales profitably.
The same automated CPT capture that drives the revenue side of the model also produces the audit trail needed to defend billing at review.
Variations and Edge Cases Across Practice Types
The worked example above assumes a mid-sized Medicare-majority cardiology practice. The same model behaves differently in other settings, so each practice type should adjust assumptions before presenting ROI.
- Solo practitioners and small practices: Fixed overhead (program coordinator, platform fees) is spread across fewer patients, which raises the break-even patient count. A program with $5,000 in monthly fixed overhead breaks even at approximately 99 active patients at a $50.63 contribution per patient; if clinical labor rises by $10 per patient, break-even rises to approximately 123 patients.
- Electrophysiology clinics: EP clinics managing patients with CIEDs must distinguish between device-monitoring CPT codes (93294, 93295, 93296 for pacemakers and ICDs on 90-day cycles; 93297 for implantable cardiovascular physiologic monitors; 93298 for subcutaneous cardiac rhythm monitors/implantable loop recorders on 30-day cycles) and the RPM physiologic monitoring codes (99453–99458). Combining these into a single revenue line creates a modeling error.
- Large integrated health systems: Risk-bearing organizations and ACOs should model ROI using the avoided medical expense equation rather than the fee-for-service reimbursement equation. A cardiac RPM program costing $63,900 per year needs to prevent approximately 7 hospitalizations annually to break even at $10,000 net savings per avoided admission.
- Commercial payer mix: UnitedHealthcare excluded chronic hypertension, diabetes, and COPD from RPM coverage in 2026, while heart failure remained covered; commercial coverage varies by payer and must be verified before projecting revenue.
Advanced Optimization: Scaling the Model Over Time
Programs that achieve positive ROI in year one typically do so on reimbursement revenue alone. Scaling requires standardized workflows so contribution margin per patient does not erode as volume grows.
Three levers matter most. Triage refinement reduces false-positive alert rates and protects nursing capacity. Cross-team coordination ensures cardiologists receive pre-triaged, actionable summaries rather than raw data. Expansion into adjacent care processes such as hypertension management lets the same monitoring infrastructure support additional CPT billing.
Rhythm360 offers distinct but integrated service lines for Rhythm-CIED (implantable devices) and HF/HTN (remote physiological monitoring), providing a centralized workspace to manage rhythm disorders, heart failure, and hypertension within a single platform. This architecture allows practices to expand monitoring scope without multiplying administrative overhead, which is the operational cost problem that prevents many programs from scaling profitably. For a detailed analysis of cost-effectiveness and revenue cycle outcomes in HF monitoring programs, see Cost Effectiveness & ROI of Heart Failure Remote Monitoring.
Frequently Asked Questions (FAQ)
Is Remote Patient Monitoring Profitable for Heart Failure?
RPM is profitable for heart failure under three conditions. The enrolled population must have a high baseline readmission rate, transmission compliance must consistently meet the 16-day monthly threshold for CPT 99454 billing, and clinical workflows must act on alerts rather than simply collect data. Under these conditions, a fully compliant Medicare patient generates approximately $103.88 per month from CPT 99454 and 99457 alone, and a 200-patient program can produce $24,000–$30,000 in monthly RPM revenue before accounting for avoided readmission savings. Programs enrolling low-risk patients, running labor-intensive workflows without redesign, or operating with low transmission compliance frequently report negative or near-zero ROI.
What Is the Typical Cost of Remote Patient Monitoring per Year?
Total RPM program cost varies by program size and staffing model. Technology platform fees typically run $10–$30 per patient per month, devices add $50–$100 per unit amortized over 18–24 months, and staffing, the largest cost driver, runs $75,000–$90,000 annually per RPM RN managing 150–250 patients. A 500-patient program carries $235,000–$380,000 in annual staffing costs alone, plus platform and device costs. For smaller RPM programs, a reasonable planning assumption is approximately $330 per patient per year (range $208–$452), based on a micro-costing study of an RPM hypertension program at NYU Langone Health, though practices should model their own staffing ratios before committing to a budget.
How Do You Calculate Heart Failure RPM ROI?
Start with the net ROI formula from Step 1, then plug in your own baseline hospitalization rate, expected reduction, average cost per avoided admission, and monthly CPT reimbursement. The key inputs include your baseline HF hospitalization rate, a conservative expected relative reduction from RPM, your average net cost per avoided admission, your expected CPT reimbursement per active patient per month, and your total program cost including staffing, technology, and devices. Run at least three scenarios, such as conservative, expected, and upside, before presenting the model to a budget committee.
When Does Heart Failure RPM Fail to Pay for Itself?
HF RPM fails to pay for itself in five documented scenarios: when the enrolled population is too low-risk to generate meaningful hospitalization reductions; when RPM is layered on top of existing care pathways rather than redesigning them, which doubles nursing workload without reducing hospitalizations; when patient transmission compliance is too low to consistently bill CPT 99454; when alert data is collected but not acted upon due to alert fatigue or inadequate triage staffing; and when the program does not reach its break-even hospitalization reduction. The break-even threshold depends on program cost and reimbursement mix. For a risk-bearing organization without reimbursement revenue, using the average hospital's Medicare reimbursement gain of $10,000 per avoided excess readmission, the program must avoid at least 0.06 admissions per patient per year to break even.
Conclusion
The ROI of heart failure RPM depends on your patient mix, your program cost structure, and your break-even hospitalization reduction. The formula is transparent, the evidence is published, and the failure modes are documented. Programs that scale profitably execute well on alert triage, documentation completeness, transmission compliance, and the ability to manage a growing patient population without proportional staffing increases.
Rhythm360 unifies CIED and HF/HTN data into a single vendor-neutral platform, automates CPT code capture and documentation, and reduces critical alert response times by up to 80%, helping practices capture up to 300% more revenue while building the operational foundation a defensible ROI model requires.
Build Your Defensible ROI Model With Rhythm360
.avif)