
How To Calculate Health System RPM ROI: A Financial Model
Build a board-ready RPM ROI model for your health system. Rhythm360 helps you quantify revenue, costs & avoided utilization. Start modeling today.

Key Takeaways for RPM ROI Modeling
- A defensible RPM ROI model rests on seven core variables, including patient population, payer mix, reimbursement rates, and attribution for avoided utilization.
- Many vendor ROI claims collapse under investment committee review because they rely on blended multiples, ignore payer mix, and skip attribution for avoided admissions.
- A fully loaded cost stack includes data-review labor, device costs, platform fees, onboarding, escalation, IT integration, and billing overhead. Data-review labor alone often exceeds half of total program costs.
- ROI shifts with payer arrangement. Fee-for-service depends on CPT billing revenue, while value-based and at-risk models depend on avoided utilization and shared savings performance.
- Rhythm360 provides the infrastructure to turn modeled ROI into operating results through unified device data, automated CPT capture, and AI-powered alert triage that reduces clinical labor costs.
See how Rhythm360 supports your RPM business case
Why RPM ROI Modeling Matters and Who Owns It
RPM ROI functions as a set of interacting variables, not a single static number. At least seven inputs drive the result: eligible patient population, enrollment and adherence rates, payer mix, reimbursement per CPT code, clinical labor minutes per patient per month, escalation rates, and contribution margin per avoided admission or ED visit. A change in any one input can materially shift the output.
Multiple stakeholders own this model. The CFO and VP of Finance own the capital allocation decision and the pro forma assumptions. The VP of Population Health owns clinical program design and enrollment projections. Cardiology service line leaders own device mix and escalation protocols. Clinical operations owns the labor model. A flawed model can produce a rejected investment or an approved but underfunded program that misses adherence targets within six months and fails to deliver billing revenue or utilization savings.
Prerequisites: Inputs You Need Before You Model
A credible RPM ROI model starts with a complete input set gathered before any arithmetic begins:
- Eligible patient population segmented by condition, including cardiac implantable electronic device (CIED) patients, heart failure, hypertension, and other chronic conditions in scope
- Current payer mix broken out by Medicare fee-for-service, Medicare Advantage, commercial, Medicaid, and any at-risk or ACO arrangements
- Baseline utilization rates, including 30-day readmission rates, ED visit rates, and average length of stay for the target population
- Clinical labor cost per hour for each staff type involved, such as RNs, care coordinators, certified cardiac technicians, and supervising physicians
- Device and platform cost quotes from vendors under evaluation
- A documented attribution method that specifies how avoided admissions will be credited to the RPM program versus other concurrent interventions
Realistic expectations help keep the work on track. A credible model usually takes days or weeks to build. The most commonly cited challenge among authors of RPM economic evaluations is uncertainty about which cost categories to include, based on a 2026 PharmacoEconomics scoping review of 84 eligible studies. That uncertainty persists unless the team deliberately defines the cost stack.
See the RPM ROI model in practice
Defining the RPM ROI Formula for Health Systems
RPM ROI = (Net reimbursement + Contribution margin from avoided utilization − Fully loaded program cost) / Fully loaded program cost. A single percentage obscures reality because payer mix and attribution method change the result. A fee-for-service system and a full-risk ACO running identical clinical programs will generate very different ROI figures from the same formula.
The RPM ROI Model: How Payer Mix Shapes the Return
The same RPM program can produce very different financial returns depending on how the health system gets paid. The table below maps the primary ROI driver by payer arrangement.
Payer Arrangement Primary ROI Driver Secondary Driver Fee-for-Service (Medicare) Billed RPM CPT revenue (99453, 99454, 99457, 99458) and documented device interrogation cycles Reduced avoidable ED visits and readmissions Medicare Advantage Per-member medical cost avoidance in targeted high-risk cohorts Risk adjustment accuracy and Star Rating performance ACO / Shared Savings Total cost of care reduction and benchmark performance driving shared savings distribution Quality measure performance gating shared savings eligibility Hospital-at-Risk / Full-Risk Avoided admissions and ED visits flowing directly to margin Reduced HRRP readmission penalties (up to 3% of Medicare revenue)
Provider-side RPM reimbursement and payer-side avoided utilization costs should not be combined into a single ROI figure because that approach can double-count value. A hybrid model should separately account for RPM reimbursement, shared savings or value-based revenue, and avoided utilization minus total program cost. In Medicare Advantage, deploying RPM indiscriminately across a general MA population often dilutes cost-effectiveness. Targeted deployment in high-risk cohorts produces stronger financial returns.
Building the Fully Loaded RPM Cost Stack
Data-review labor often disappears from vendor RPM decks even though it drives a large share of total cost. The 2026 PharmacoEconomics scoping review found that staff salaries (62%) and equipment or technology (56%) were the most frequently reported RPM cost components, which means many published models already omit key categories before anyone applies them to a health system context.
A fully loaded remote patient monitoring cost per patient should include every line below:
- Device cost, including FDA-cleared connected blood pressure cuffs, weight scales, pulse oximeters, or cardiac monitors, amortized over device lifetime
- Platform cost, including monthly SaaS or per-patient licensing fees
- Patient onboarding, including setup, education, and consent documentation, corresponding to CPT 99453 on the revenue side
- Clinical labor for data review, modeled as minutes per patient per month by staff type and loaded hourly rate
- Escalation and triage labor, covering incremental time for patients who generate alerts above threshold
- IT and integration, including EHR interface build, ongoing maintenance, and data security overhead
- Billing overhead, including documentation review, claim submission, and denial management
A 2025 economic study of hypertension RPM programs provides a benchmark. It reported approximately $330 per patient in total program cost and approximately $172 per patient in data-review cost alone, with a modeled 22.2% ROI under those assumptions. That data-review figure, which represents more than half the total program cost, is the line item most frequently absent from vendor-provided pro formas.
The Revenue Side: RPM CPT Codes and the 2026 Outlook
Medicare bills RPM using four foundational procedure codes that represent distinct service components. CMS pays for education and setup, device supply, and treatment and management separately at the same rate regardless of device type or health data collected.
The four foundational codes and their approximate 2026 national non-facility rates are:
- CPT 99453, one-time device setup and patient education: approximately $21.71
- CPT 99454, device supply and data transmission for 16–30 days per month: approximately $52.11
- CPT 99457, first 20 minutes of monitoring and clinical management per month: approximately $51.77
- CPT 99458, each additional 20 minutes of monitoring and management: approximately $41.42
CMS also introduced two new codes for 2026. CPT 99445 covers device supply and transmission for 2–15 days per month at approximately $52.11, and CPT 99470 covers the first 10 minutes of monitoring and management at approximately $26.05. These new codes remove the previous 16-day cliff where patients transmitting on fewer days generated no device-supply revenue. CPT 99445 and 99454 cannot be billed in the same period, and 99470 and 99457 cannot be billed together in the same calendar month.
Reimbursement stability functions as a scenario variable. The Consolidated Appropriations Act of 2026 extended key Medicare telehealth flexibilities through December 31, 2027, which provides near-term stability. At the same time, CMS's CY 2027 proposed rule would require billable RPM services to be furnished by clinical staff employed by the billing practitioner rather than third-party contractors. That change would effectively eliminate outsourced clinical monitoring arrangements if finalized. Any multi-year RPM financial model should include a scenario in which this restriction takes effect January 1, 2027, with explicit staffing and cost implications.
Avoided Utilization and the Attribution Trap
Avoided admissions and ED visits often represent the largest potential ROI source under value-based and at-risk models, but they only carry weight when measured against a control group. A 2025 systematic review of 40 randomized controlled trials (published 2017–2024) found a pooled risk ratio of 0.86 (95% CI 0.77–0.95) for hospitalizations among RPM patients versus usual care, based on low-certainty evidence. That effect is meaningful yet far smaller than the utilization reductions often cited in vendor materials. Vendor ROI claims that attribute all utilization savings to RPM without a control group should face heavy discounting in any investment committee presentation.
The Michigan Medicine RPM program, which reported approximately $12 million in savings and a 59% reduction in admissions, illustrates a more rigorous approach because it used a defined comparison methodology. The team compared hospitalizations in the six months before enrollment to the six months after, rather than relying on simple before-and-after reporting. Even so, the EPOCA cost-effectiveness model, which estimated a 46% reduction in hospitalizations and €10,764 in net savings per patient from the collective perspective, explicitly acknowledged that its effectiveness inputs came from a pre-post comparison without a control group. Regression to the mean and time-varying confounding may have influenced those results.
A board-ready model uses a documented control group or a matched cohort comparison as the attribution standard. If neither exists at program launch, the model should present avoided utilization as a scenario with a stated confidence range rather than a single point estimate.
Build your RPM business case with Rhythm360
Worked Example: A 1,000-Patient RPM Cohort
The following model uses explicit assumptions so readers can substitute their own figures and stress-test the structure.
Inputs:
- Eligible population: 1,000 patients
- Enrollment rate: 70% → 700 enrolled patients
- Adherence rate meeting the 16-day transmission threshold: 75% → 525 productive patients per month
- Payer mix assumption: 80% Medicare fee-for-service, 20% Medicare Advantage
- Monthly reimbursement per productive FFS patient: $104 (99454 + 99457); $145 with one 99458 add-on unit on 50% of patients, which produces a blended ~$124 per month
- Clinical labor: 25 minutes per patient per month at $45 per hour loaded cost, or $18.75 per patient per month
- Device cost: $8 per patient per month, amortized
- Platform cost: $15 per patient per month
- Onboarding and billing overhead: $5 per patient per month
- Total variable cost per productive patient: $46.75 per month
- Fixed overhead for IT, integration, and management: $10,000 per month
Monthly arithmetic for FFS patients only, 420 productive FFS patients:
- Gross reimbursement: 420 × $124 = $52,080
- Variable cost: 525 × $46.75 = $24,544 for all enrolled productive patients
- Fixed cost: $10,000
- Monthly contribution: $52,080 − $24,544 − $10,000 = $17,536
- Annualized FFS contribution: approximately $210,000
Three assumptions drive most of the swing in this model. Adherence matters most. Dropping from 75% to 60% removes 105 productive patients and roughly $90,000 in annual contribution. Labor cost comes next. A $10 per hour increase in the loaded rate adds approximately $52,500 in annual cost for this cohort. Reimbursement levels form the third driver. Any reduction in 99454 or 99457 rates flows straight to margin. The Medicare Advantage population's ROI is modeled separately as avoided utilization against program cost, rather than as CPT revenue.
This output represents a scenario built on stated assumptions. Present it to the investment committee as a base case that invites sensitivity testing.
Because the base case rests on assumptions rather than actuals, the next step is to test how far the contribution moves when the two most sensitive inputs, adherence and labor cost, shift.
Sensitivity Analysis: Stress-Testing the RPM Business Case
The table below shows how the annual FFS contribution from the worked example changes when adherence and labor cost move together, highlighting the two variables that drive the widest swing in outcomes.
Scenario Adherence Rate Labor Cost (loaded/hr) Annual FFS Contribution (approx.) Low 55% $55 ~$85,000 Base 75% $45 ~$210,000 High 85% $40 ~$290,000
All figures above are derived from the stated assumptions in the worked example. Patient compliance in RPM programs averages around 55% when using non-cellular devices, which makes the low-adherence scenario a realistic baseline for programs without automated engagement tools. Every number in this table traces to a stated assumption rather than an unsegmented industry multiple.
In-House vs. Outsourced Monitoring: Modeling the Staffing Decision
The CY 2027 proposed rule raises the stakes on the staffing decision. If CMS finalizes the requirement that clinical monitoring staff be directly employed by the billing practitioner, health systems that rely on outsourced monitoring teams will need to rebuild their cost stack.
An in-house model requires explicit modeling of several elements:
- FTE count based on panel size, where industry benchmarks suggest one care coordinator can actively manage 80–120 patients per week using an alert-driven dashboard, versus 15–25 patients per week via manual phone outreach
- Recruitment and onboarding cost
- Benefits, training, and continuing education
- Coverage for nights, weekends, and vacations
- Technology required to support the team
An outsourced or platform-supported model with optional certified cardiac technician oversight shifts fixed staffing costs to variable per-patient costs, which can help during program ramp-up. However, providers who currently rely on outsourced clinical staff for RPM should assess whether they can reasonably shift such responsibility to directly employed clinical staff by January 2027 if the proposed rule is finalized. Model both scenarios with explicit staffing assumptions and flag the regulatory risk as a sensitivity variable.
Where Rhythm360 Fits in Your RPM ROI Model
Rhythm360 is a vendor-neutral, HIPAA-compliant, cloud-based RPM platform built for health systems that need to turn a modeled ROI into an operating result. The platform unifies data from all major CIED manufacturers and chronic condition sensors into a single source of truth, which removes fragmented OEM portal workflows that inflate clinical labor costs and create documentation gaps.
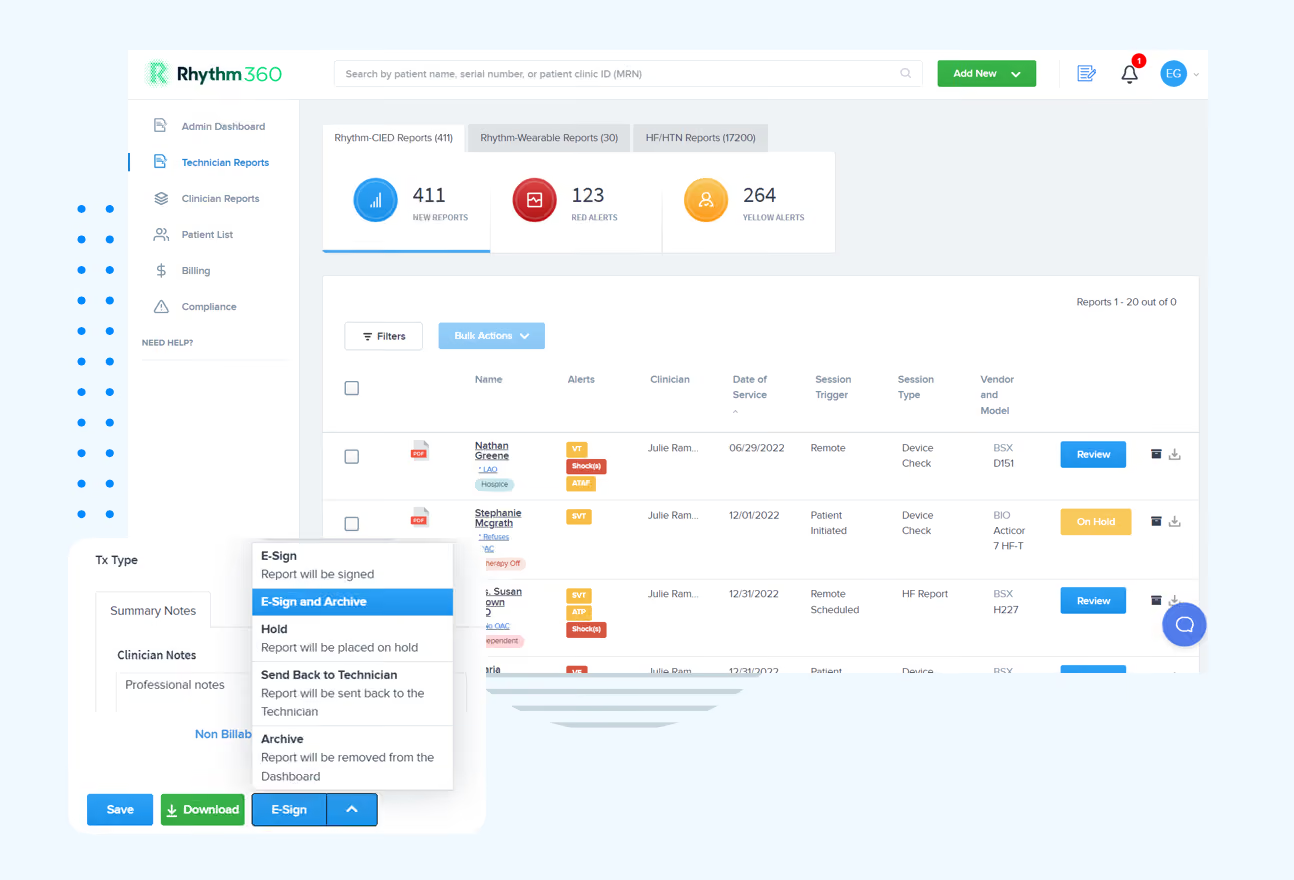
Bi-directional EHR integration with Epic, Cerner, Athenahealth, eClinicalWorks, and Greenway Health keeps RPM data inside existing clinical workflows rather than in parallel documentation. Automated CPT code capture covers device-specific billing cycles: 90-day cycles for pacemakers and ICDs (93294 for pacemaker professional, 93295 for ICD professional, and 93296 for the technical component) and 30-day cycles for physiologic monitors (93297 for implantable cardiovascular physiologic monitors) and loop recorders (93298 for subcutaneous cardiac rhythm monitors or implantable loop recorders). Each can be billed once per 30 days and split into professional (-26) and technical (-TC) components. This structure prevents device-type mismatch denials and unbilled technical components, which rank among the most common sources of revenue leakage in cardiac monitoring programs.
AI-powered alert triage filters non-actionable noise and prioritizes clinically significant events. Optional 24/7/365 certified cardiac technician oversight is available for programs that need round-the-clock coverage. The University of Chicago Medicine implemented Rhythm360 and now reviews more than 73,000 reports annually, averaging more than 18,000 reports per quarter. Clinicians report the ability to review more transmissions daily and identify more abnormalities. UCM also reported improved billing and accountability following the integration.
Rhythm360 clients have reported up to an 80% reduction in critical alert response times and up to a 300% increase in revenue capture and profitability. Other platforms in this space include Murj, Implicity, Rhythm Management Group, and Octagos.
Operational and Clinical Validation: Proving the Model in Practice
A pro forma functions as a hypothesis that needs real-world validation. Confirming that the RPM program is working requires tracking specific metrics against the model assumptions that generated the projected return.
- Enrollment rate, measured as actual enrolled patients versus eligible population, because shortfalls reduce both reimbursement and utilization savings
- Adherence rate, measured as the percentage of enrolled patients meeting the 16-day transmission threshold for CPT 99454, which often represents the most sensitive variable in the FFS model
- Alert response times, measured as time from alert generation to documented clinical action, which affects clinical outcomes and avoided-utilization assumptions
- Documentation completeness, measured as the percentage of patient months with complete billing documentation, since incomplete documentation drives claim denials
- CPT capture rates, measured as actual codes billed per patient per month versus the model assumption, where gaps signal adherence shortfalls or billing workflow failures
Replace model assumptions with actuals on a rolling quarterly basis. A pro forma that never updates against actuals cannot withstand a year-two budget review. For implementation guidance, see Cardiology Remote Monitoring: Practice Implementation Guide.
Variations and Edge Cases in RPM ROI Modeling
The 1,000-patient cohort model scales differently for a 10,000-patient system. Fixed IT and integration costs shrink as a share of total cost per patient at scale, which improves unit economics. Payer mix often varies significantly by service line. A cardiology service line may skew heavily toward Medicare fee-for-service, while a primary care population health program may include a larger Medicare Advantage or commercial share. Model each service line separately instead of applying a single blended payer mix.
Device mix also changes the model. CIED patients generate revenue under the 93294–93298 code family on billing cycles that differ from the 99453–99458 RPM family. Heart failure patients monitored via CardioMEMS pulmonary artery sensors have different device costs and clinical labor requirements than hypertension patients using connected blood pressure cuffs. A single model that blends all device types without segmentation will produce unreliable outputs. For heart failure monitoring specifics, see Remote Heart Failure Monitoring: Platforms & Coverage.
Advanced RPM Program Optimization Over Time
A mature RPM program steadily replaces assumptions with actuals and uses that data to expand scope and improve economics. Standardizing data ingestion across all device manufacturers removes manual reconciliation labor. Refining alert triage thresholds reduces escalation labor cost while maintaining clinical sensitivity. Expanding into adjacent chronic conditions, such as adding hypertension monitoring to an existing heart failure program, spreads fixed platform and IT costs across a larger patient base.
AI-assisted decision support will become increasingly important as data volumes grow, a point clinical leadership at the University of Chicago Medicine has emphasized. Rhythm360 onboarding and EHR integration typically take a few days to a few weeks, which allows health systems to move from model to live program without a prolonged implementation cycle.
Operationalize your RPM ROI model with Rhythm360
Frequently Asked Questions
Is Remote Patient Monitoring Profitable?
RPM can generate profit when payer mix, adherence, and the fully loaded cost stack, including data-review labor, align with the model. In fee-for-service settings, a patient who meets the 16-day transmission threshold and receives 20 minutes of clinical management generates approximately $104 per month in Medicare reimbursement from CPT 99454 and 99457 combined. Against a fully loaded cost of roughly $40–$55 per patient per month, contribution margin remains positive for programs that maintain adequate adherence. The hypertension RPM study cited earlier modeled a 22.2% ROI and showed that programs targeting high-acuity patients with documented hospitalization risk outperform broad, low-acuity enrollment.
What Is the Typical Cost of Remote Patient Monitoring Per Year?
Per-patient annual costs vary by condition, device type, and staffing model. The hypertension RPM study referenced above reported roughly $330 per patient in total program cost, with data-review labor accounting for about half of that amount. The 2026 PharmacoEconomics scoping review of 84 RPM economic evaluations found that staff salaries and equipment or technology were the two most frequently reported cost categories, appearing in 62% and 56% of studies respectively. For planning purposes, a fully loaded cost stack that includes device, platform, onboarding, clinical labor, escalation, IT, and billing overhead often falls in the range of $40–$70 per patient per month, or $480–$840 per patient per year, with labor cost and escalation frequency driving most of the variation.
How Do You Calculate RPM ROI for a Health System?
RPM ROI = (Net reimbursement + Contribution margin from avoided utilization − Fully loaded program cost) / Fully loaded program cost. Build the model in components. Start with the eligible population, apply enrollment and adherence rates to calculate productive patients, and multiply by payer-mix-weighted reimbursement per patient per month. Subtract the fully loaded cost stack. Add avoided utilization value only for payer arrangements where the health system bears utilization risk. Run the calculation separately for each payer arrangement instead of blending them. Present the output as a set of scenarios with sensitivity ranges on adherence, labor cost, and reimbursement.
Does Medicare Pay for Remote Patient Monitoring in 2026?
Medicare covers RPM in 2026 under CPT codes 99453, 99454, 99457, and 99458, with two new codes added for 2026: 99445 for device supply covering 2–15 days of transmission per month and 99470 for the first 10 minutes of clinical management. The connected device must meet the FDA's definition of a medical device and transmit data digitally. The patient must have a chronic or acute condition that requires monitoring. Key Medicare telehealth flexibilities remain in place through December 31, 2027, under the Consolidated Appropriations Act of 2026. At the same time, CMS's CY 2027 proposed rule, issued July 14, 2026, would restrict RPM billing to clinical staff directly employed by the billing practitioner and may restructure the current 17 RPM codes into four HCPCS G-codes. Health systems should treat reimbursement risk as a scenario variable in any multi-year RPM pro forma.
What Transmission Thresholds Affect RPM Billing Eligibility?
RPM billing eligibility depends on how many days a patient transmits data and on required clinical interactions. CPT 99454 requires that the connected device transmit physiologic data for at least 16 days within a 30-day period to qualify for the full device-supply code, while the new CPT 99445 covers the 2–15 day range. Treatment management codes 99457 and 99458 require at least one interactive communication with the patient per calendar month. Health systems should confirm current CMS billing requirements with their compliance and coding teams because thresholds and documentation standards can change through the annual Physician Fee Schedule rulemaking process.
How Do You Attribute Avoided Admissions to RPM?
A credible attribution method uses a control group or matched cohort comparison. The 2025 systematic review of 40 randomized controlled trials cited earlier found a pooled risk ratio of 0.86 (95% CI 0.77–0.95) for hospitalizations in RPM versus usual care, based on low-certainty evidence. Before-and-after comparisons without a control group face regression to the mean and time-varying confounding, as the EPOCA cost-effectiveness model authors acknowledged. For investment committee purposes, present avoided utilization as a scenario with a stated relative risk reduction drawn from a named source. Apply that reduction to the baseline admission rate for the target population, multiply by the contribution margin per avoided admission, and flag the attribution assumption explicitly.
Talk to our team about your ROI model
Conclusion: Building a Pro Forma the Finance Committee Can Stress-Test
A board-ready RPM ROI model follows a clear structure. State the formula and separate the payer-mix economics. Build the fully loaded cost stack with data-review labor as an explicit line item, then model reimbursement revenue by CPT code. Value avoided utilization only against a control group with a stated attribution method. Run sensitivity on adherence, labor cost, and reimbursement, and model the in-house versus outsourced staffing decision as a separate scenario given the CY 2027 proposed rule.
The output functions as a range of scenarios with traceable assumptions that the finance committee can interrogate and that clinical operations can update with actuals once the program is live. Successful execution combines a pro forma the finance committee can stress-test with a platform that delivers the data reliability, automated CPT documentation, and auditable billing records the model assumes. Rhythm360 is built for that second requirement.
Talk to our team about your RPM business case
.avif)