Cardiac Telemetry ROI Calculator: Cost Savings Guide
Last updated: June 17, 2026
Key Takeaways
Fragmented cardiac telemetry workflows waste bed capacity, staff time, and increase length of stay. Unified AI-powered platforms convert that waste into measurable savings.
The first-year ROI framework uses a clear formula that combines bed-day waste reduction, staffing efficiency, LOS impact, and recovered CPT revenue into a finance-ready business case.
2026 benchmarks place telemetry monitoring at about $54 per patient-day. Conservative modeling shows more than 105% first-year ROI for mid-size hospitals that modernize workflows.
AI-powered vendor-neutral platforms cut non-indicated monitoring days, unify multi-OEM data streams, shorten alert response times, and automate CPT documentation so facilities capture the full savings potential.
Net Benefit = Total Annual Savings − Platform Investment Cost
Each savings module below fills one variable in this formula. Complete all four modules, then plug the totals into the kernel formula to generate a defensible, finance-ready ROI percentage.
2026 Benchmark Callout: Inpatient Cardiac Telemetry Cost Per Patient Day
Average added cost of inpatient cardiac telemetry monitoring is approximately $53–$54 per patient-day.
Use $54/day as the working benchmark in all modules below, or substitute your facility’s actual figure. This per-day cost becomes the multiplier in every savings calculation: each wasted telemetry day costs $54, each LOS reduction saves $54, and each efficiency gain is valued against this baseline.
Telemetry Utilization Waste Reduction and Savings (Module 1)
Non-indicated telemetry days create direct, recurring waste that you can quantify. Clinical guidelines from the American Heart Association identify a substantial proportion of inpatient telemetry days as non-indicated. Peer-reviewed literature has documented inappropriate telemetry utilization rates in general medical-surgical units. For a 200-bed hospital running 60 telemetry beds at 80% occupancy, this pattern can represent thousands of avoidable patient-days each year.
Module 1 Inputs:
T = Total annual telemetry patient-days
W = Waste rate (use 0.35 as a conservative default)
C = Daily cost per telemetry patient ($54 default)
Module 1 Formula (copy-paste):
Bed-Day Waste Savings = T × W × C
Example: 17,520 days × 0.35 × $54 = $330,624/year
Rhythm360 supports this savings category with real-time utilization dashboards that flag non-indicated monitoring days against AHA guideline criteria. Charge nurses and hospitalists can discontinue telemetry on schedule instead of allowing default extensions.
Rhythm360
Staffing Efficiency Gains That Reduce Telemetry Overhead (Module 2)
Staff time lost to multi-portal logins, manual data transcription, and redundant documentation drives telemetry overhead every day. Remote patient monitoring programs that consolidate cardiac data into a single workflow have shown measurable reductions in administrative time per patient encounter. Centralized monitoring platforms also reduce the per-patient coordination burden on nursing staff, freeing clinical hours for direct patient care.
2026 Benchmark Callout: Staffing Efficiency
Centralized monitoring platforms can reduce time spent navigating OEM portals and performing manual data transcription.
Module 2 Inputs:
P = Average daily census of monitored patients
S = Minutes saved per patient per shift (use your facility estimate)
H = Hourly loaded staff rate (use your facility rate)
D = Operating days per year (365)
Module 2 Formula (copy-paste):
Annual Staffing Savings = P × (S ÷ 60) × H × D
Example: Calculation depends on your specific inputs for time saved and staff rate.
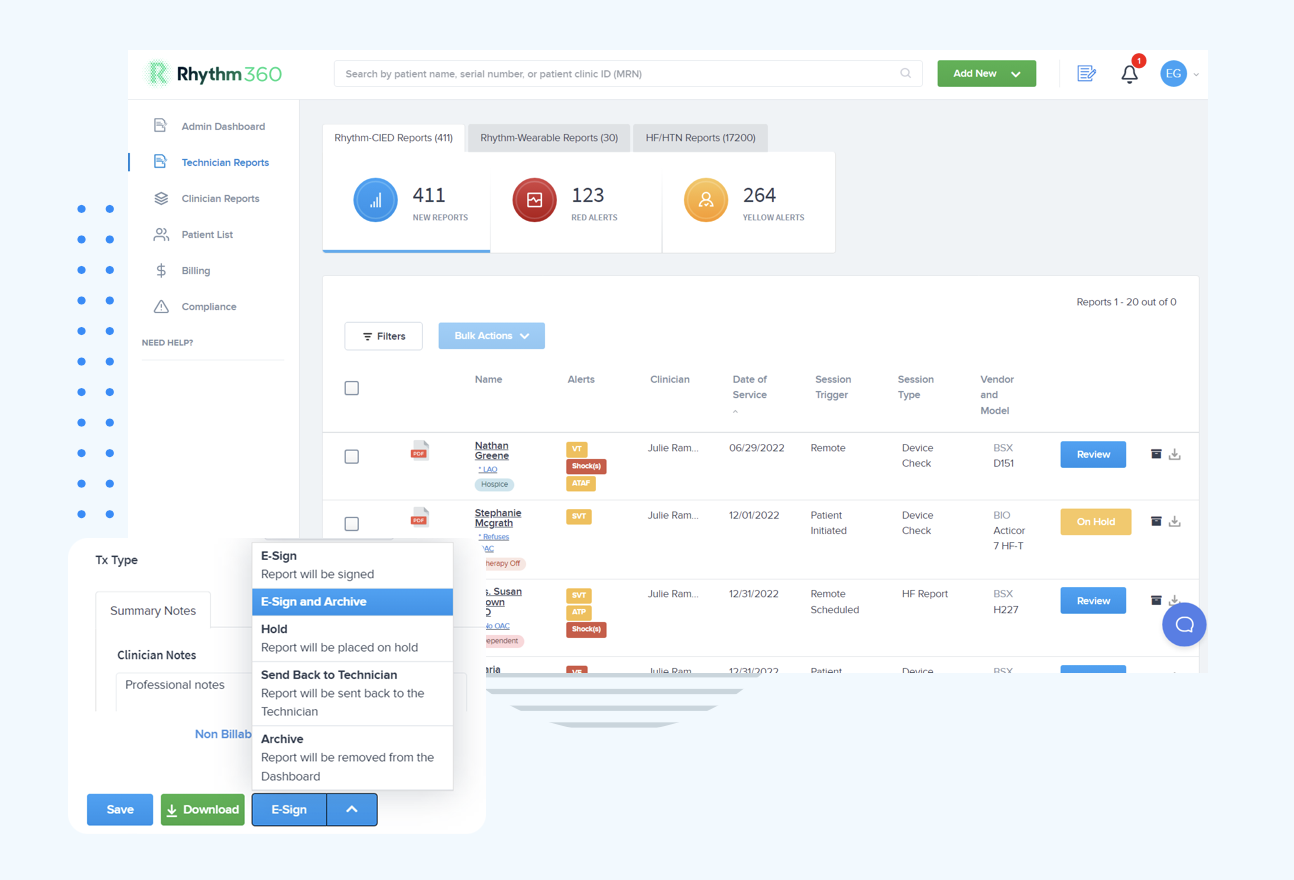
Rhythm360 supports this savings category by consolidating all OEM data streams, including Medtronic, Boston Scientific, Abbott, Biotronik, and others, into a single vendor-neutral dashboard with bi-directional EHR integration. This consolidation removes redundant logins and manual transcription.
Length-of-Stay Impact of Optimized Telemetry Monitoring (Module 3)
L = Expected LOS reduction per patient (use 0.4 days as a conservative value)
B = Fully loaded bed-day cost ($54 default)
Module 3 Formula (copy-paste):
LOS Impact Savings = A × L × B
Example: 2,190 admissions × 0.4 days × $54 = $47,304/year
Rhythm360 supports this savings category by reducing critical alert response times by up to 80% through AI-powered triage. Earlier clinical intervention helps patients reach discharge-readiness sooner.
Recovered CPT Revenue From Remote Cardiac Monitoring (Module 4)
Recovered CPT revenue adds a fourth, often overlooked, savings stream to the ROI model. Remote cardiac monitoring generates billable CPT codes that many facilities fail to capture consistently because of documentation gaps and audit risk concerns.
Module 4 Inputs:
R = Number of eligible remote monitoring patients per year
V = Average number of billable events or periods per patient per year
F = Average allowed amount per CPT event (blended rate across codes such as 93298, 93299, 99454, 99453, 99457)
G = Realization rate (percentage of eligible events successfully billed and paid)
Module 4 Formula (copy-paste):
Recovered CPT Revenue = R × V × F × G
Example: Calculation depends on your panel size, event frequency, payer mix, and documentation performance.
Rhythm360 supports this revenue stream by automating CPT code documentation, maintaining the audit trail required for claim approval, and aligning reports with current CMS requirements.
Mid-Size Hospital Example: 105%+ First-Year ROI
This example applies all four modules to a representative 200-bed community hospital with 60 telemetry beds operating at 80% occupancy. That profile yields 17,520 telemetry patient-days per year, about 2,190 annual admissions, and an average daily census of 48 monitored patients.
These figures use conservative inputs and a consistent $54/day benchmark across all modules. Facilities with higher waste rates, larger monitored populations, or significant CPT billing gaps can realize materially higher returns.
The four modules above give you the conceptual framework for telemetry ROI. This template turns that framework into a working calculator that you can build in Excel or Google Sheets. Each row represents one variable or calculation from the modules and shows where to enter your facility’s data and which formulas to apply.
How Modern AI-Powered Platforms Unlock Telemetry ROI
Realizing the savings in each module requires consistent data quality, workflow automation, and CPT compliance infrastructure. Legacy OEM portals and on-premise systems rarely deliver these inputs reliably. A vendor-neutral AI-powered platform addresses each gap through a three-layer architecture.
First, the platform normalizes disparate device data streams through API, HL7, XML, and computer vision-based PDF parsing to create a single unified data set. Second, it applies AI-driven alert triage to that unified data to reduce non-actionable notifications so staff focus on clinically relevant events. Third, it automates CPT code documentation for those events to close billing gaps. Bi-directional EHR integration then ensures that savings captured in this monitoring workflow flow directly into the revenue cycle without manual re-entry.
These platform capabilities make the ROI projections achievable only when facilities avoid the implementation mistakes that commonly erode returns.
Common Pitfalls That Erode Cardiac Telemetry ROI
Several recurring implementation failures push realized ROI below projected figures. Incomplete OEM data coverage leaves device populations unmonitored, which understates both waste and recovery opportunity. When that incomplete data does reach the monitoring team, alert fatigue from unfiltered legacy systems causes staff to deprioritize notifications, which negates LOS and response-time gains.
Even when staff respond to alerts, CPT code documentation gaps, particularly for codes 93298, 93299, and 99454, create claim denials that erase recovered revenue projections. Single-portal dependency then amplifies all three problems. If one OEM server becomes unavailable, monitoring gaps appear, exposing the facility to adverse event liability and undermining staffing efficiency gains.
Frequently Asked Questions
How much does cardiac telemetry cost per day in 2026?
The $54/day benchmark reflects 2026 cost pressures that affect telemetry programs. Labor inflation, including RN wages up by double digits in many markets, increases the staffing component of each monitored day. Multi-OEM licensing fees and support contracts add recurring software expense. Capital equipment depreciation for telemetry hardware and network infrastructure contributes additional cost. Facilities with older equipment or higher nurse-to-patient ratios on telemetry floors will trend toward the upper end of this range.
What percentage of telemetry days are inappropriate according to guidelines?
Peer-reviewed literature and AHA guideline analyses identify a substantial proportion of inpatient telemetry days in general medical-surgical settings as non-indicated or extending beyond the clinically appropriate monitoring window. Hospitals with limited utilization review protocols or no automated discontinuation triggers tend to experience higher waste rates. Guideline-based discontinuation workflows supported by real-time utilization dashboards provide the primary lever for reducing this waste category.
How much staff time is spent logging into multiple OEM portals versus a unified dashboard?
Facilities that manage devices from two or more manufacturers, a common pattern because most cardiology programs implant devices from Medtronic, Boston Scientific, Abbott, and Biotronik, require device technicians and monitoring nurses to navigate separate, non-interoperable portals. Staff then reconcile data and manually transcribe findings into the EHR. A consolidated, vendor-neutral platform reduces this time and converts the saved minutes per patient into meaningful annual staffing savings for a mid-size hospital.
What 2026 reimbursement changes affect remote cardiac monitoring?
CMS finalized updates to the remote physiological monitoring CPT code families effective January 2026. Key codes affected include 99453, 99454, and 99457 for remote physiological monitoring. Documentation requirements now specify the minimum number of days of data collection, the qualifications of the reviewing clinician, and the audit trail requirements for billing compliance. Practices without automated documentation infrastructure face elevated claim denial rates under these updated requirements. A platform with built-in CPT compliance tooling and automated report generation provides the most reliable mechanism for capturing this revenue consistently.
Conclusion
A defensible cardiac telemetry monitoring ROI case rests on four quantified savings modules, which include bed-day waste reduction, staffing efficiency, LOS impact, and recovered CPT revenue, applied against a credible platform investment figure using 2026 benchmarks. The kernel ROI formula and modular calculator structure above give cardiology administrators, CFOs, and directors of cardiology services a ready-to-use framework.
This ROI framework becomes achievable only with infrastructure that eliminates manual data reconciliation, reduces alert noise by 60–80%, and closes CPT billing gaps automatically. Rhythm360 delivers these capabilities through its vendor-neutral architecture and bi-directional EHR integration, aligning operational performance with every savings variable in this model.