Last updated: July 14, 2026
Pre-symptomatic detection provides the highest-impact intervention point in continuous heart failure monitoring. HeartLogic alerts precede HF symptoms by a median of 12 days and hospitalizations by a median of 38 days, creating a substantial window that weekly manual reviews routinely miss.
Pro tip: Configure weight-alert suppression rules that account for known dietary or medication changes, so the system flags true volume overload rather than post-holiday sodium intake. This contextual filtering only works when the underlying data stream is reliable, which makes redundant OEM data feeds essential to prevent silent alert loss during manufacturer maintenance windows.
Continuous monitoring creates a real-time titration signal that scheduled office visits cannot match. A retrospective analysis from the Swedish Heart Failure Registry found that medium or optimal GDMT doses reduced all-cause mortality at 12 months compared with low-dose therapy. Yet the EMPACE study documented delays from discharge to quadruple GDMT initiation, with SGLT2 inhibitor initiation often occurring after discharge, a gap that continuous monitoring can close.
Pro tip: Role-based mobile access lets on-call clinicians approve titration decisions from a smartphone, which removes the 24–48 hour delay that occurs when decisions wait for a workstation login. Andrew Beaser, MD, at the University of Chicago Medicine noted, “I am more likely to sign off on these while in meetings because I can easily access them on my phone.”
Alert detection without a defined response pathway produces the untreated high-risk signals documented in ALLEVIATE-HF. A multidisciplinary framework closes the loop between data and intervention.
Pro tip: When all device data, alert history, and care notes live in one dashboard, the time a device technician spends reconciling data across OEM portals before a team huddle drops to near zero. That efficiency gain reduces burnout and supports staff retention.
Patient behavior between transmissions determines whether clinical interventions remain effective. Automated education and communication tools extend the care team’s reach without adding headcount.
Pro tip: Integrated communication logs with full audit trails reduce the time staff spend on follow-up calls and provide defensible documentation for payer audits. This combination delivers both operational and compliance benefits.
The sequence below reflects a typical implementation path from contract signature to first live transmission review, broken into seven phases. EHR integration and staff training can run in parallel after Step 3.
Outcome measurement closes the quality improvement loop and provides the data needed to justify program expansion. The metrics below apply to both CIED and HF/HTN RPM service lines within a single platform login.
| Metric | Measurement Method | Target Benchmark |
|---|---|---|
| Alert-to-action response time | Timestamp from alert generation to documented clinical action | <1 business day for Tier 3; <72 hours for Tier 2 |
| Transmission compliance rate | Percentage of scheduled transmissions received vs. expected | >99% with redundant data feeds |
| CPT units captured per patient per month | Automated billing documentation report (93298, 99454, 99457, 99458) | Track trend at 30, 60, and 90 days; target ≥20% improvement vs. baseline |
| 30-day HF hospitalization rate | EHR-linked admission data compared to pre-implementation baseline | 18–32% reduction consistent with published remote monitoring evidence |
| GDMT titration rate | Percentage of alert-triggered patients with documented medication adjustment | >70% |
| Patient engagement rate | Percentage of enrolled patients with at least one documented interaction per month | >85% based on RPM program benchmarks |
Cardiology practices implementing RPM for heart failure patients have achieved reductions in hospital readmissions through continuous monitoring and timely interventions, with key performance indicators tracked via analytics dashboards and EHR-integrated tools. Reporting both CIED and HF/HTN RPM metrics from a single login removes the reconciliation step that consumes staff time when data lives in separate systems.
Every step in this playbook relies on one foundational capability: a single, vendor-neutral dashboard that normalizes data from every OEM at the same time. Rhythm360 by RhythmScience is built specifically for that requirement.
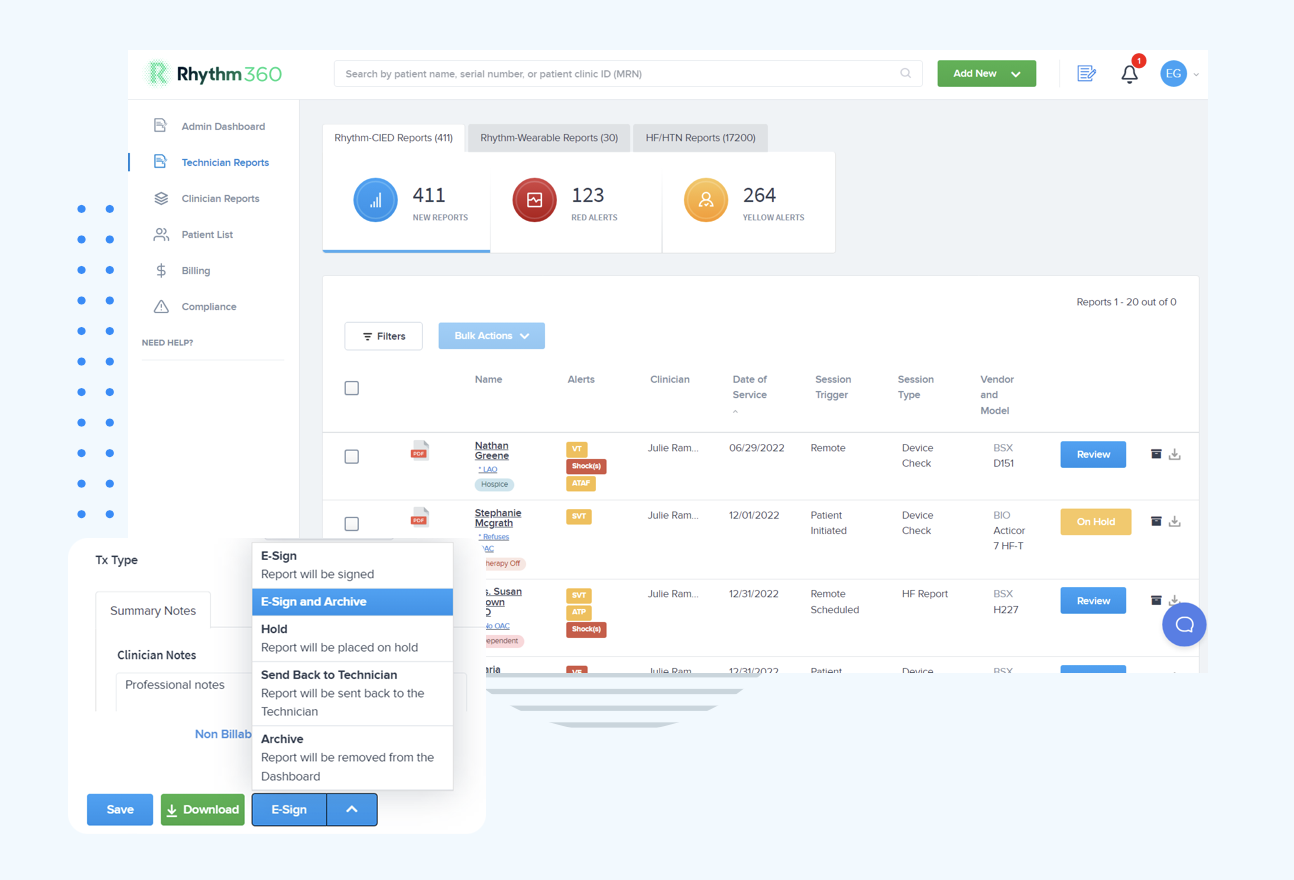
Rhythm360 ingests API, HL7, XML, and unstructured PDF data from Medtronic, Boston Scientific, Abbott, Biotronik, and other manufacturers using computer vision and AI-powered normalization. This approach achieves greater than 99.9% data transmissibility through redundant feeds. AI-driven alert triage filters non-actionable transmissions and prioritizes clinically significant events, which can reduce critical alert response times by up to 80%. Automated documentation and bi-directional EHR integration with Epic, Cerner, Athenahealth, eClinicalWorks, and Greenway Health remove manual transcription and support compliant CPT code capture across both the Rhythm-CIED and HF/HTN RPM service lines within one login.
The University of Chicago Medicine implemented Rhythm360 to manage more than 73,000 reports annually, with Dr. Gaurav Upadhyay noting, “We have improved billing and accountability for our patients after the integration.” Practices using Rhythm360 have documented up to 300% improvement in revenue outcomes through stronger CPT capture and the addition of new RPM service lines without adding headcount.
A HIPAA-compliant mobile application lets clinicians review transmissions, sign reports, and coordinate care from any location. This flexibility removes workstation dependency and speeds on-call decisions.
Most practices see operational improvements such as faster alert response times, reduced manual data retrieval, and increased transmission review volume within the first 30 days of go-live. Clinical outcome changes, including the hospitalization reductions shown in the Step 6 benchmark table, typically become measurable at 60–90 days post-implementation once a sufficient patient-months denominator exists for comparison. Rhythm360 can reduce critical alert response times by up to 80%, so the alert-to-action pathway that drives hospitalization reductions operates from the first live transmission review.
Adding a structured HF/HTN RPM service line alongside an existing CIED monitoring program creates new recurring monthly revenue through CPT codes 99453, 99454, 99457, and 99458, in addition to CIED-specific codes 93298 and 93299. Practices that previously under-captured these codes because of incomplete documentation or manual tracking have achieved up to 300% improvement in revenue outcomes after adopting Rhythm360’s automated CPT documentation and billing support. The platform’s administrative dashboard provides a real-time view of captured versus potential CPT units, which helps practices identify and close billing gaps proactively. Rhythm360 supplies documentation and workflow infrastructure that supports better billing outcomes, while revenue cycle management decisions remain with the practice and its billing team.
Each major CIED manufacturer, including Medtronic, Boston Scientific, Abbott, and Biotronik, operates a proprietary portal with distinct data formats and transmission protocols. Without a unifying layer, device technicians must log into each portal separately, reconcile data manually, and then transcribe findings into the EHR. Rhythm360 removes that burden by ingesting data through APIs, HL7 feeds, XML files, and unstructured PDFs using computer vision and AI normalization. Redundant data feeds act as a fail-safe when any single OEM server experiences downtime, maintaining the transmissibility threshold described in the platform overview above. The result is a single, normalized patient record that reflects data from all implanted devices, regardless of manufacturer.
CPT 99453, which covers initial setup and patient education for RPM, becomes billable at patient enrollment. CPT 99454, which covers device supply and daily recording or programmed alert transmission, activates once the patient’s monitoring device transmits data for at least 16 days in a calendar month. CPT 99457, which covers the first 20 minutes of RPM treatment management per calendar month, and CPT 99458, which covers each additional 20 minutes, activate when clinical staff spend the required interactive time reviewing data and communicating with the patient. For CIED patients, CPT 93298, which covers remote monitoring with physician review and report, and CPT 93299, which covers remote monitoring technical support, activate upon compliant transmission review and documentation. Rhythm360’s automated documentation system tracks time, interactions, and transmission counts against each CPT code’s requirements in real time and flags patients who are approaching or have met billing thresholds.
Rhythm360 manages both CIED monitoring and HF/HTN RPM within one integrated environment. Distinct but connected service lines, Rhythm-CIED for implantable device monitoring and HF/HTN for remote physiological monitoring, operate inside the same dashboard and under the same login. A patient with both a CRT-D device and active HF RPM enrollment appears in a unified record that displays device transmission data, weight trends, blood pressure readings, and alert history in one view. Alert routing, documentation, and CPT tracking for both service lines run concurrently without requiring staff to switch platforms or reconcile data from separate systems. This architecture allows practices to expand monitoring programs without proportional increases in headcount.
The six steps in this playbook, which include pre-symptomatic alert action, GDMT titration, multidisciplinary response pathways, patient education, structured implementation, and outcome measurement, form a complete operational framework for continuous heart failure monitoring. Each step depends on the same underlying requirement, which is device data from every OEM, normalized and actionable in a single dashboard and available to the right clinician at the right time.
The clinical evidence supporting this approach remains consistent across dozens of trials and tens of thousands of patients. The COAST registry documented a 69% reduction in HF hospitalizations after CardioMEMS implementation with structured remote management. The TIM-HF2 trial showed reduced cardiovascular hospitalization days and lower all-cause mortality with telemonitoring. The 2026 Scholte et al. meta-analysis confirmed that these benefits hold across major patient subgroups. The pre-symptomatic detection windows described in Step 1, which extend up to 38 days before hospitalization, create the intervention opportunity that drives these outcomes. The evidence also shows, most clearly in ALLEVIATE-HF, that the alert-to-action pathway functions as the true intervention because data without a workflow does not improve outcomes.
Rhythm360 delivers that workflow. One login, every OEM, AI triage, automated documentation, mobile sign-off, and simultaneous CIED and HF/HTN RPM service lines operate together with greater than 99.9% data reliability and an implementation timeline measured in days to weeks, not months.